PSI Metrics for Kubernetes Graduates to GA
Since its original implementation in the Linux kernel in 2018, Pressure Stall Information (PSI) has provided users with the high-fidelity signals needed to identify resource saturation before it becomes an outage. Unlike traditional utilization metrics, PSI tells the story of tasks stalled and time lost, all in nicely-packaged percentages of time across the CPU, memory, and I/O.
With the recent release of Kubernetes v1.36, users across the ecosystem have a stable, reliable interface to observe resource contention at the node, pod, and container levels. In this post, we will dive into the improvements and performance testing that proved its readiness for production.
Beyond utilization: why PSI?
Monitoring CPU or memory usage alone can be misleading. A node may report XX% (below 100%) CPU utilization while certain tasks are experiencing severe latency due to scheduling delays. PSI fills this gap by providing:
- Cumulative Totals: Absolute time spent in a stalled state.
- Moving Averages: 10s, 60s, and 300s windows that allow operators to distinguish between transient spikes and sustained resource tension.
Proving stability: performance testing at scale
A common concern when graduating telemetry features is the resource overhead required to collect and serve the metrics. To address this, SIG Node conducted extensive performance validation on high-density workloads (80+ pods) across various machine types.
Our testing focused on two primary scenarios to isolate the impact of the Kubelet and kernel-level collection respectively:
- Kernel PSI ON / Kubelet Feature OFF vs Kernel PSI ON / Kubelet Feature ON (Kubelet overhead)
- Kernel PSI OFF / Kubelet Feature ON vs Kernel PSI ON / Kubelet Feature ON (Kernel overhead)
Scenario 1: The Kubelet Overhead
First, we looked at the kubelet usage on 4 core machines (Case 1). For these, the Linux kernel was already tracking pressure on both clusters by default(psi=1), but we toggled the KubeletPSI feature gate to see if the Kubelet actively querying and exposing these metrics impacted the resource usage. The synchronized bursts seen in the graph are practically identical in both magnitude and frequency, confirming that the Kubelet's collection logic is highly lightweight and blends seamlessly into standard housekeeping cycles. There is no issue about the feature affecting the pre-existing resource use, staying within the normal 0.1 cores or 2.5% of the total node capacity, and is therefore safe for production-scale deployments.
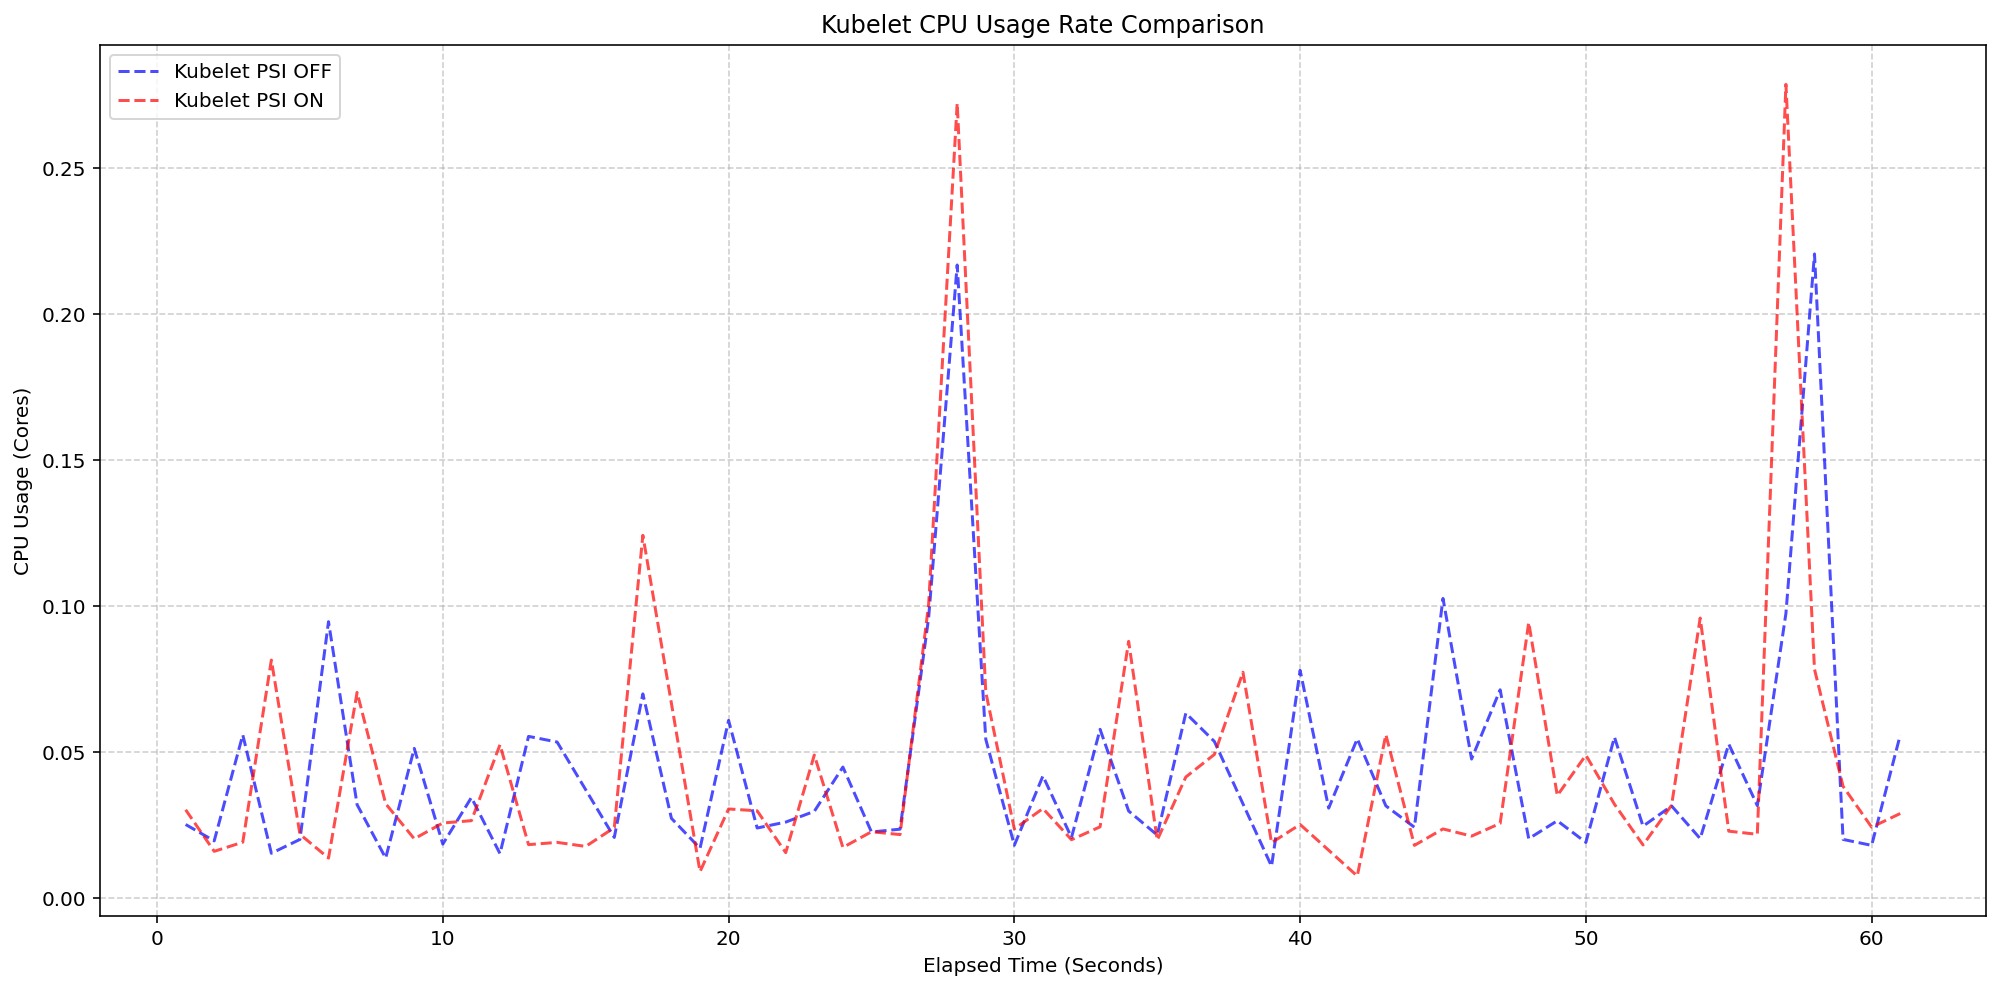
(Case 1) Kubelet CPU Usage Rate Comparison
Figure 2: Kubelet CPU Usage Rate Comparison.
Next, we evaluated the system overhead in the same run. As seen in the following graph, the System CPU usage lines for the Kubelet PSI-enabled (red) follows the same pattern as the Kubelet PSI-disabled (blue) clusters, with a slight expected increase from the baseline. This visualizes that once the OS is tracking PSI, at around 2.5 cores, the act of Kubernetes reading those cgroup metrics is negligible to performance.
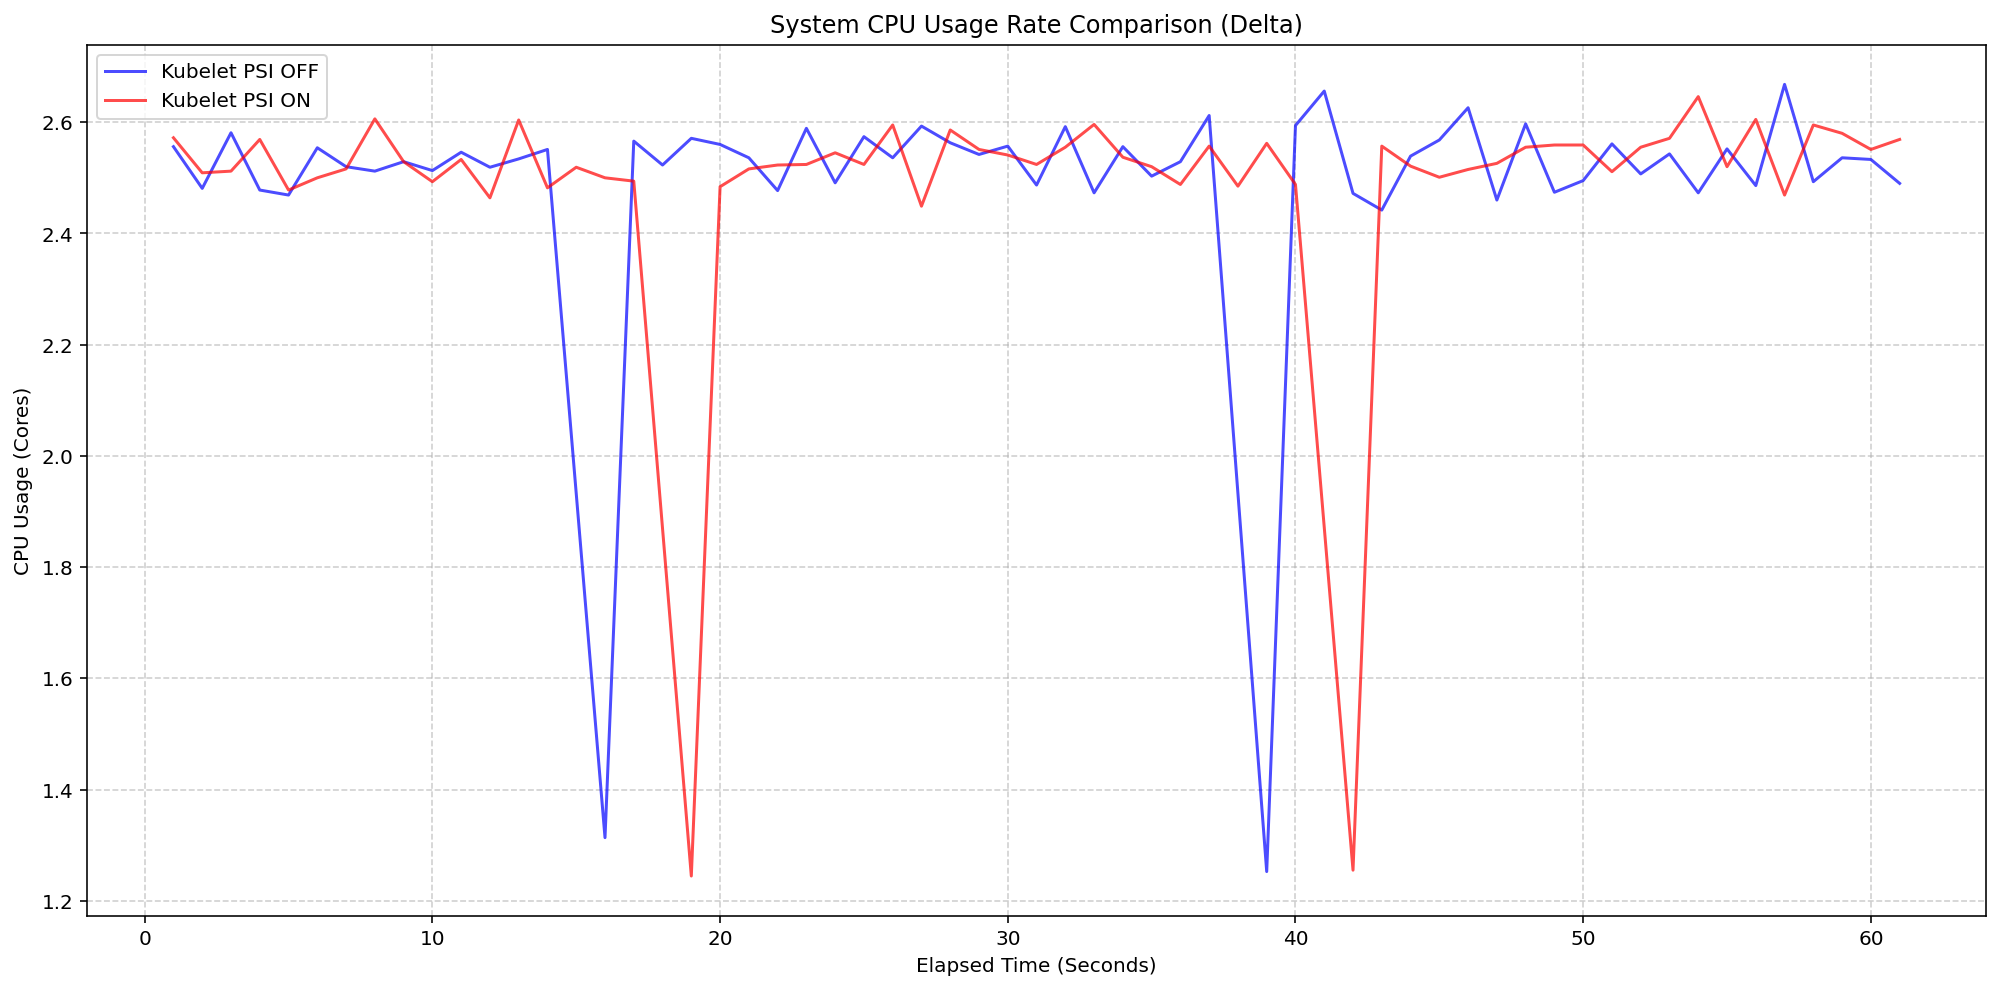
(Case 1) System CPU Usage Rate Comparison
Figure 1: Node System CPU Usage Rate Comparison.
Scenario 2: The Kernel Overhead
Shifting gears, we evaluated the underlying overhead of enabling PSI on the Linux kernel also on a 4 core machine. By comparing a cluster booted with psi=1 (COS default) against a cluster with psi=0, we isolated the exact cost of the OS-level bookkeeping. Even under heavy I/O and CPU load at an 80-pod density, the System CPU delta between the kernel-enabled and kernel-disabled clusters remained consistently between 0.037 cores and 0.125 cores or 0.925% - 3.125% of the total node capacity. There was a single spike to 0.225 cores, or 5.6%, but was controlled back down within a few seconds. This confirms that the internal kernel tracking is highly efficient under load.
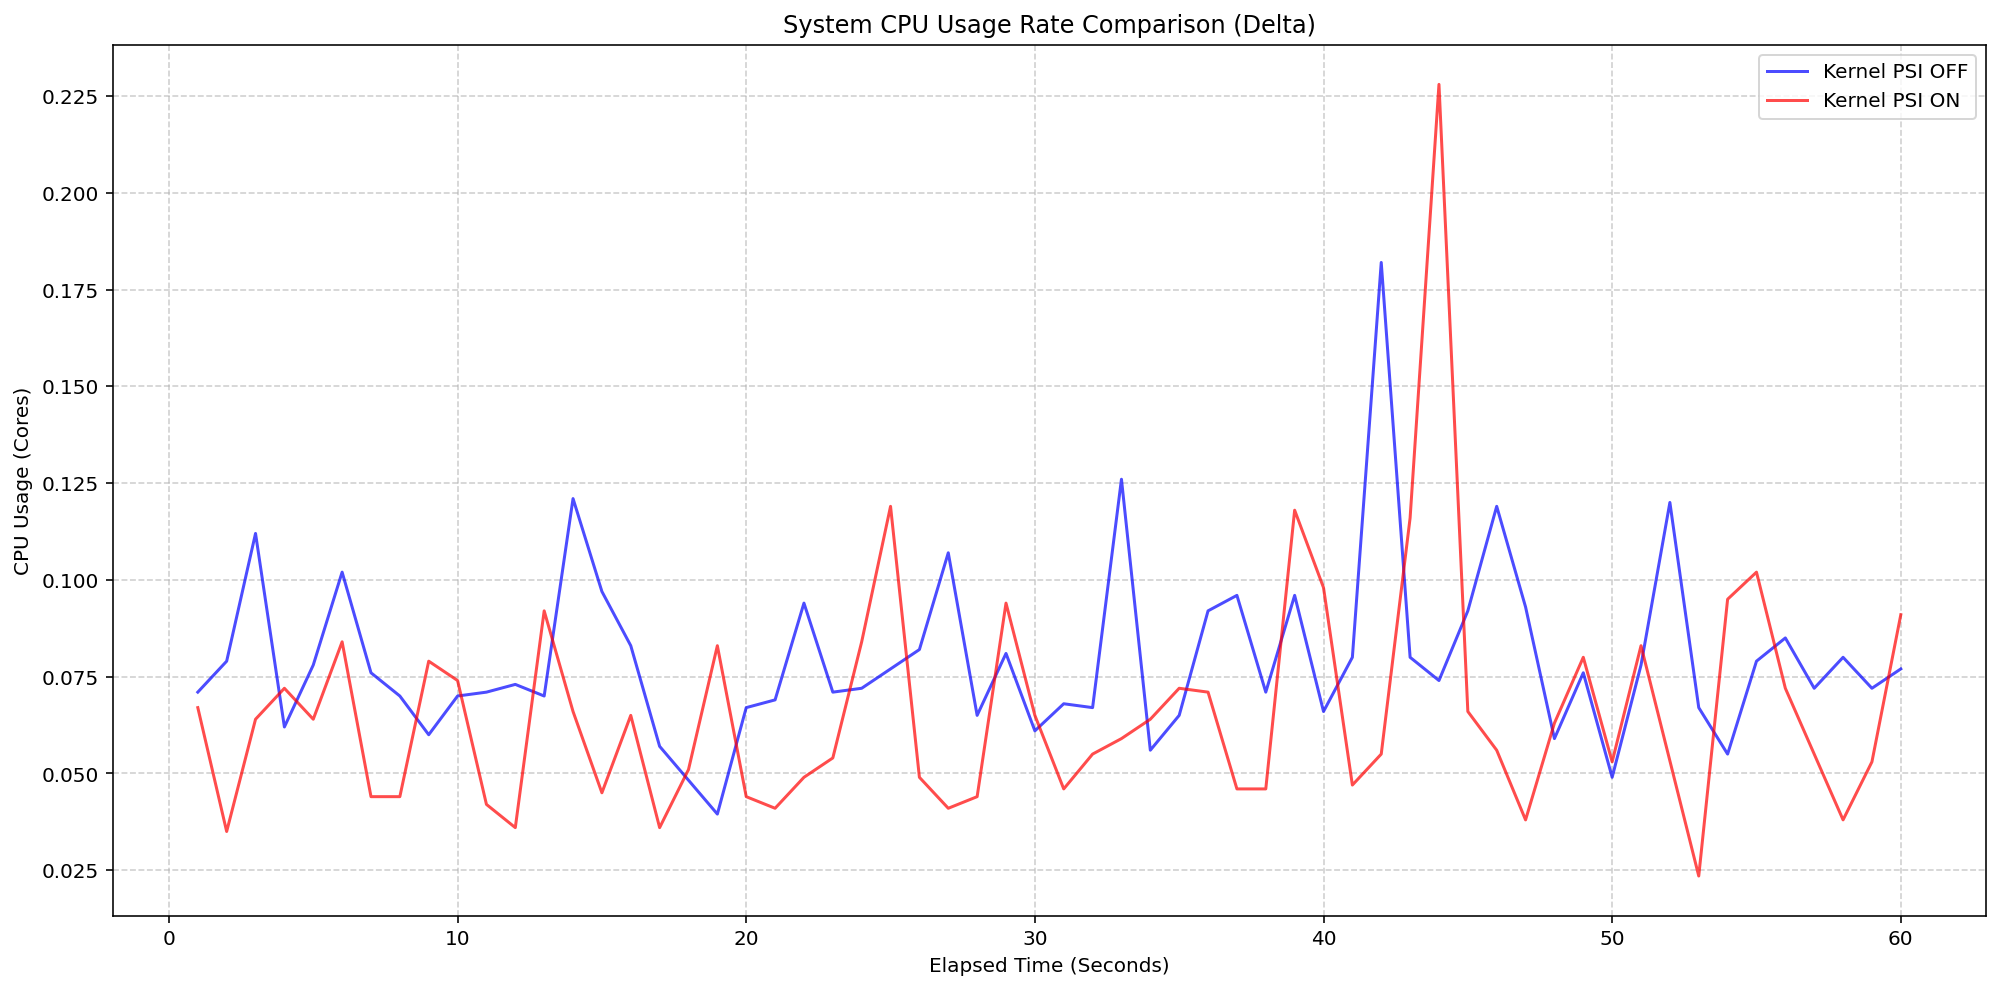
(Case 2) Node System CPU Usage Rate Comparison
Figure 3: Node System CPU Usage Rate Comparison.
Figure 4 zooms in on the kubelet process itself, which serves as the primary collector for these metrics. . The results show that even while the kubelet performs periodic sweeps to aggregate data from the cgroup hierarchy, its CPU usage remains remarkably low with interchangeable spikes and nothing exceeding 0.25 cores or 6.25% of total capacity for longer than a second.
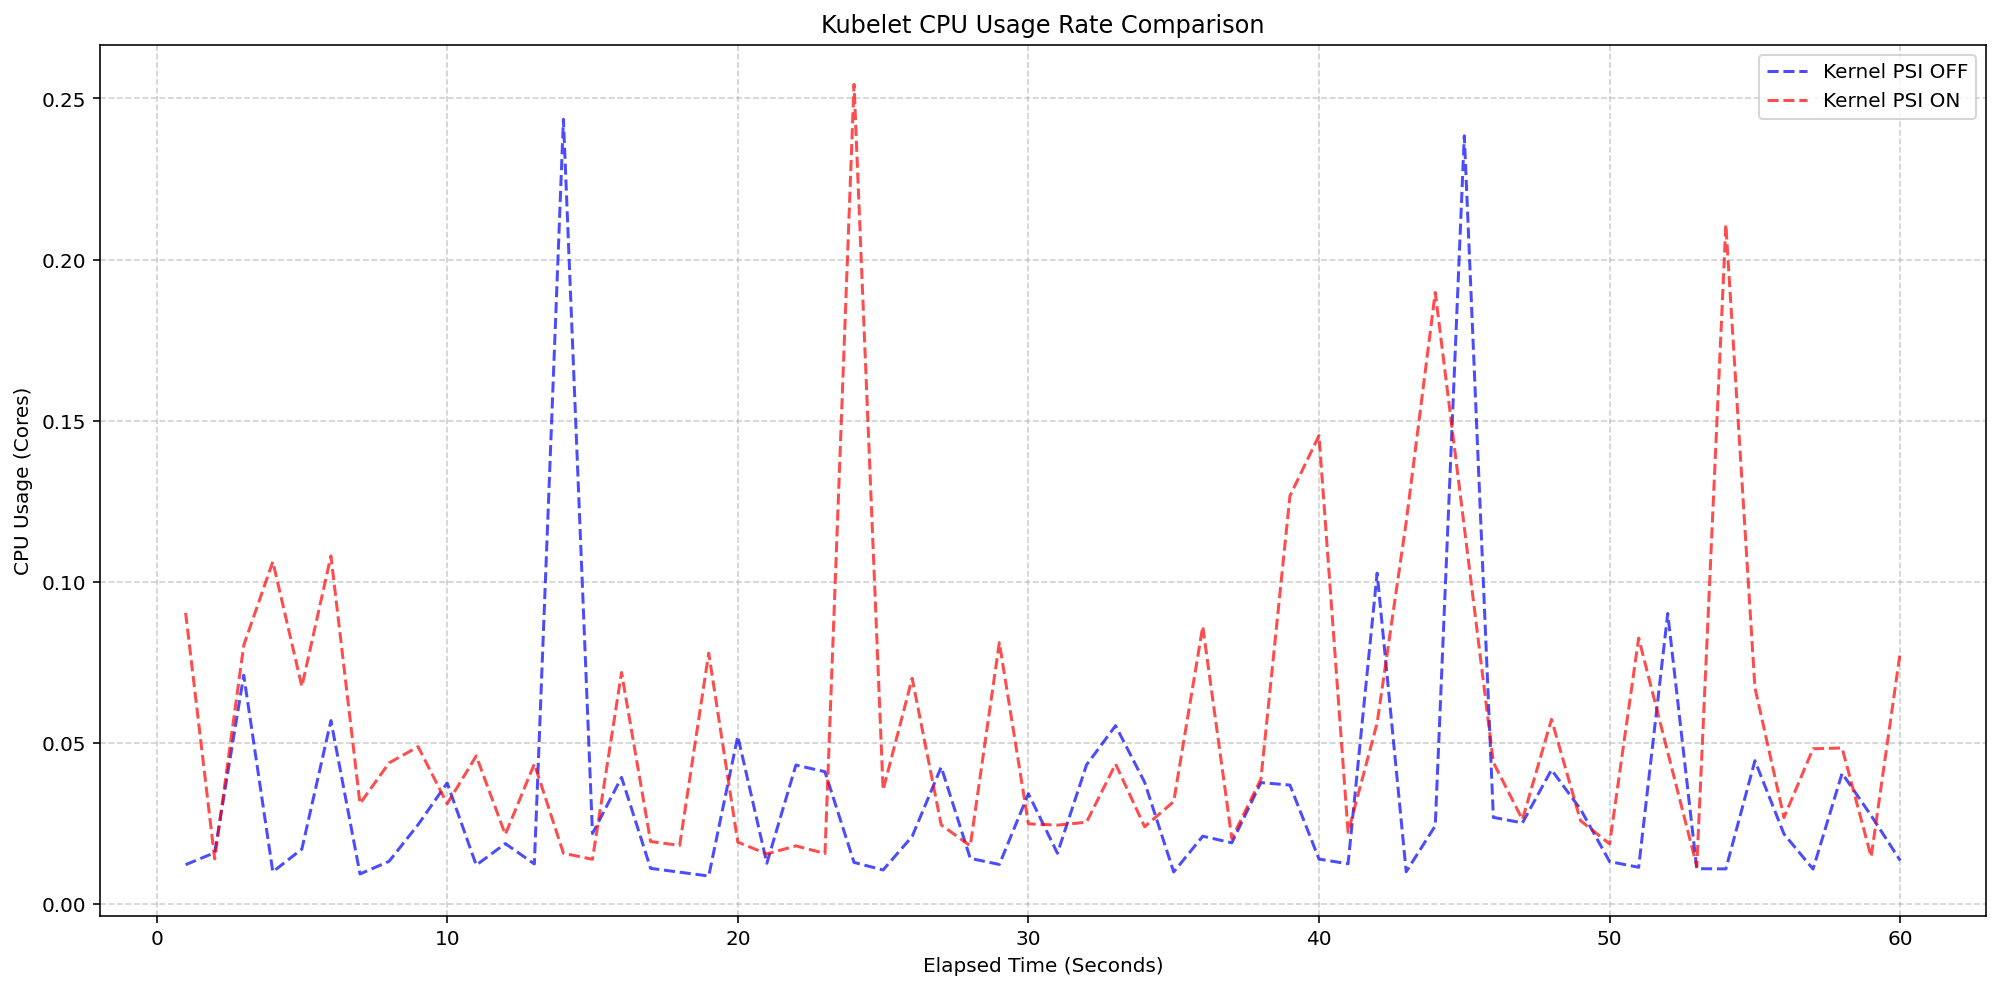
(Case 2) Kubelet CPU Usage Rate Comparison
Figure 4: Kubelet CPU Usage Rate Comparison.
Improvements between beta (1.34) and stable (1.36)
- Smarter Metric Emission for GA: We improved how the Kubelet handles underlying OS support for PSI. Previously, if the feature was enabled in Kubernetes but the underlying Linux kernel didn't support PSI (
psi=0), the Kubelet would emit misleading zero-valued metrics. These could trigger false alarms when read as real metrics instead of missing values. In v1.36, the Kubelet now detects OS-level PSI support via cgroup configurations before reporting. This ensures that pressure metrics are only collected and emitted when they are actually supported by the node, providing cleaner data for monitoring and alerting systems.
Getting started
To use PSI metrics in your Kubernetes cluster, your nodes must meet the following requirements:
- Ensure your nodes are running a Linux kernel version 4.20 or later and are using cgroup v2.
- Ensure PSI is enabled at the OS level (your kernel must be compiled with
CONFIG_PSI=yand must not be booted with thepsi=0parameter).
As of v1.36, Kubelet PSI metrics are generally available and you do not need to opt in to any feature gate.
Once the OS prerequisites are met, you can start scraping the /metrics/cadvisor endpoint with your Prometheus-compatible monitoring solution or query the Summary API to collect and visualize the new PSI metrics. Note that PSI is a Linux-kernel feature, so these metrics are not available on Windows nodes. Your cluster can contain a mix of Linux and Windows nodes, and on the Windows nodes, the kubelet will simply omit the PSI metrics.
If your cluster is running a recent enough version of Kubernetes and you are a privileged node administrator, you can also proxy to the kubelet's HTTP API via the control plane's API server to see real-time pressure data from the Summary API.
Caution: Proxying to the kubelet is a privileged operation. Granting access to it is a security risk, so ensure you have the appropriate administrative permissions before executing these commands.
CONTAINER_NAME="example-container"
kubectl get --raw "/api/v1/nodes/$(kubectl get nodes -o jsonpath='{.items[0].metadata.name}')/proxy/stats/summary" | jq '.pods[].containers[] | select(.name=="'"$CONTAINER_NAME"'") | {name, cpu: .cpu.psi, memory: .memory.psi, io: .io.psi}'
Further reading
If you want to dive deeper into how these metrics are calculated and exposed, check out these resources:
- The official Kernel documentation
- Understanding PSI in the Kubernetes documentation
- cAdvisor Metrics Implementation
Acknowledgements
Support for PSI metrics was developed through the collaborative efforts of SIG Node. Special thanks to all contributors who helped design, implement, test, review, and document this feature across its journey from alpha in v1.33, through beta in v1.34, to GA in v1.36.
To provide feedback on this feature, join the Kubernetes Node Special Interest Group, participate in discussions on the public Slack channel (#sig-node), or file an issue on GitHub.
Feedback
If you have feedback and want to share your experience using this feature, join the discussion:
- SIG Node community page
- Kubernetes Slack in the #sig-node channel
- SIG Node mailing list
SIG Node would love to hear about your experiences using this feature in production!